Graphing Linear Functions Practice Worksheet
Practice graphing linear equations using slope, intercepts, and tables of values.
Try graphing each linear function on your own first. Then click Show solution to check the slope, intercepts, key points, and completed graph.
Key Linear Function Ideas
- The slope tells you how steep the line is.
- The \(y\)-intercept is where the line crosses the \(y\)-axis.
- Linear equations graph as straight lines.
- Slope-intercept form is: \[ y=mx+b \]
Level 1: Basic Slope-Intercept Form
Problem 1
Graph the linear function.
Show solution
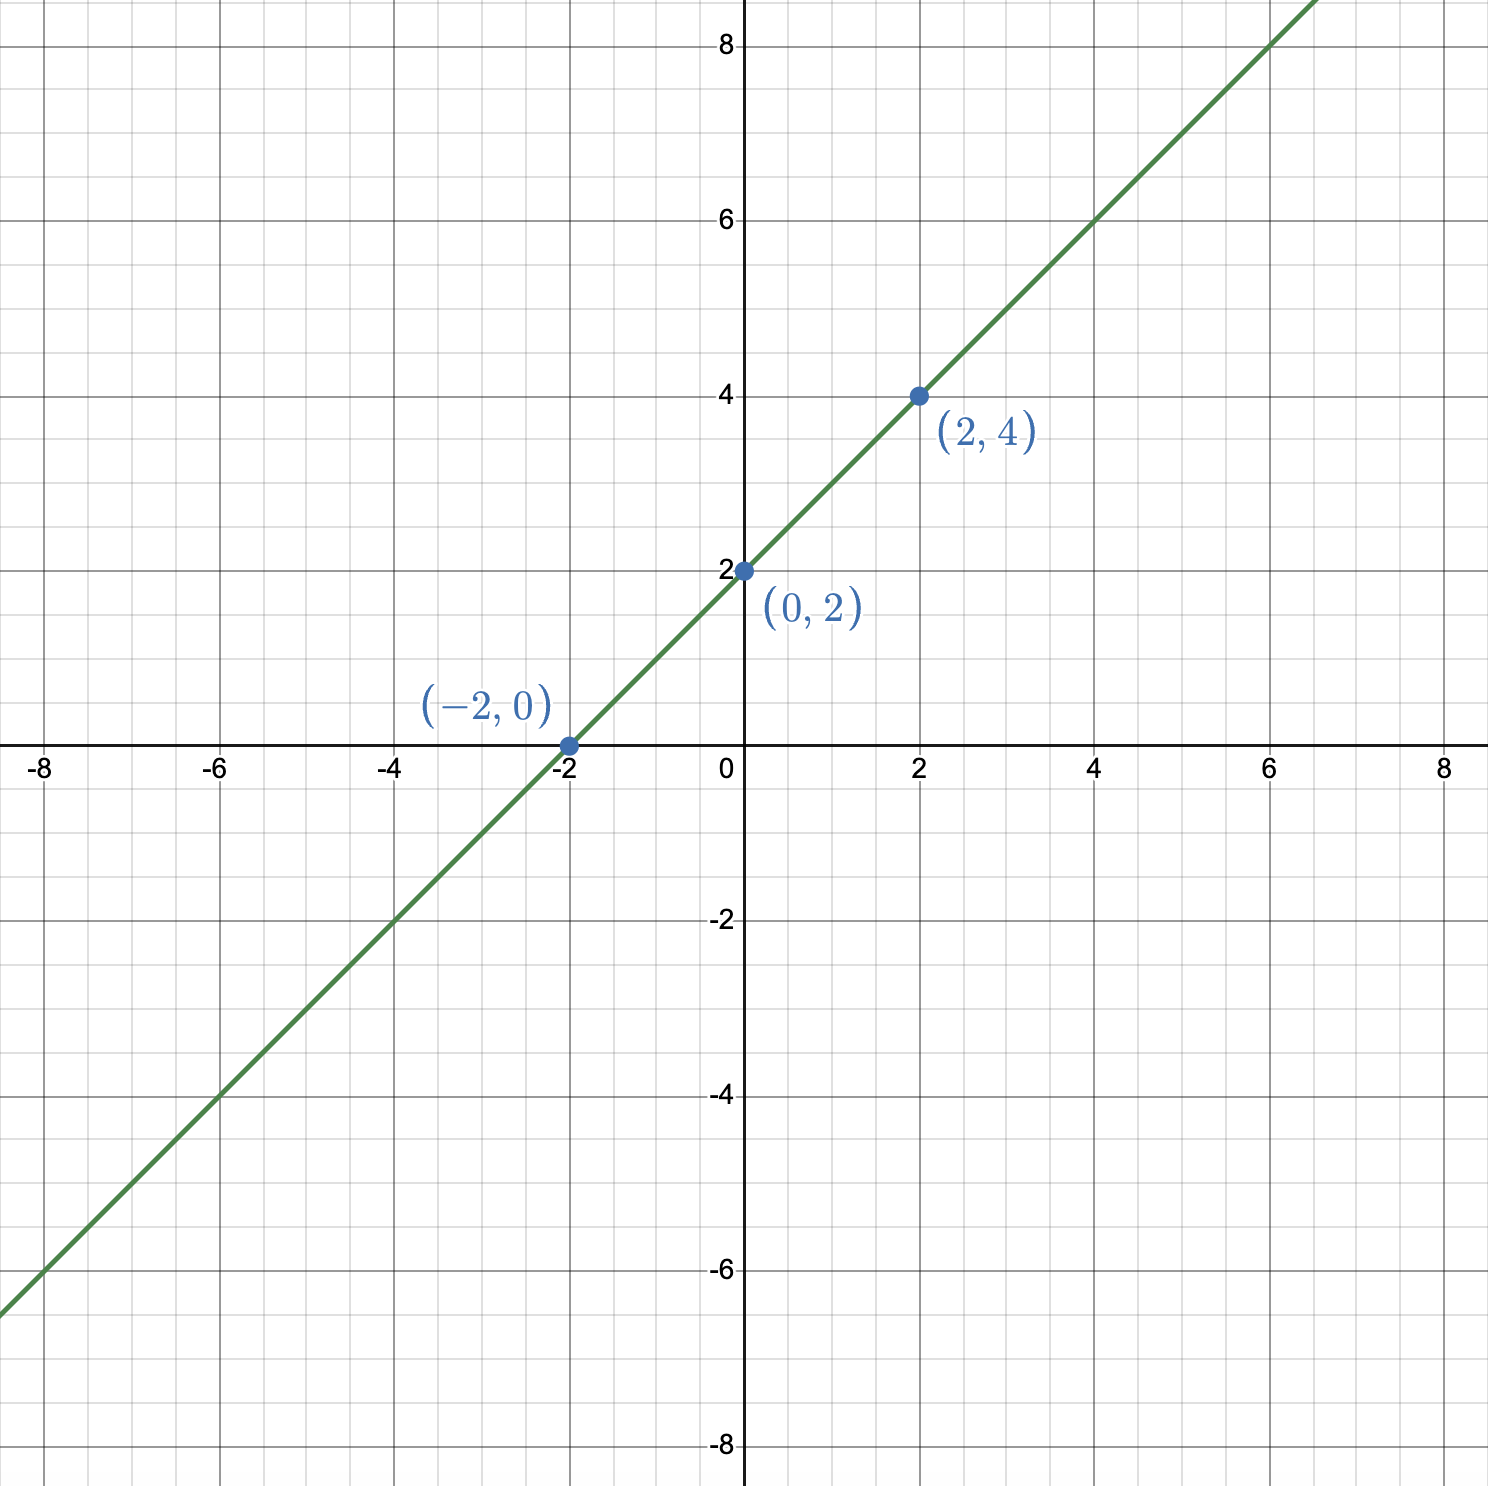
The slope is \(1\), and the \(y\)-intercept is \(2\).
Key points:
\[ (-2,0),\ (0,2),\ (2,4) \]
Problem 2
Graph the linear function.
Show solution
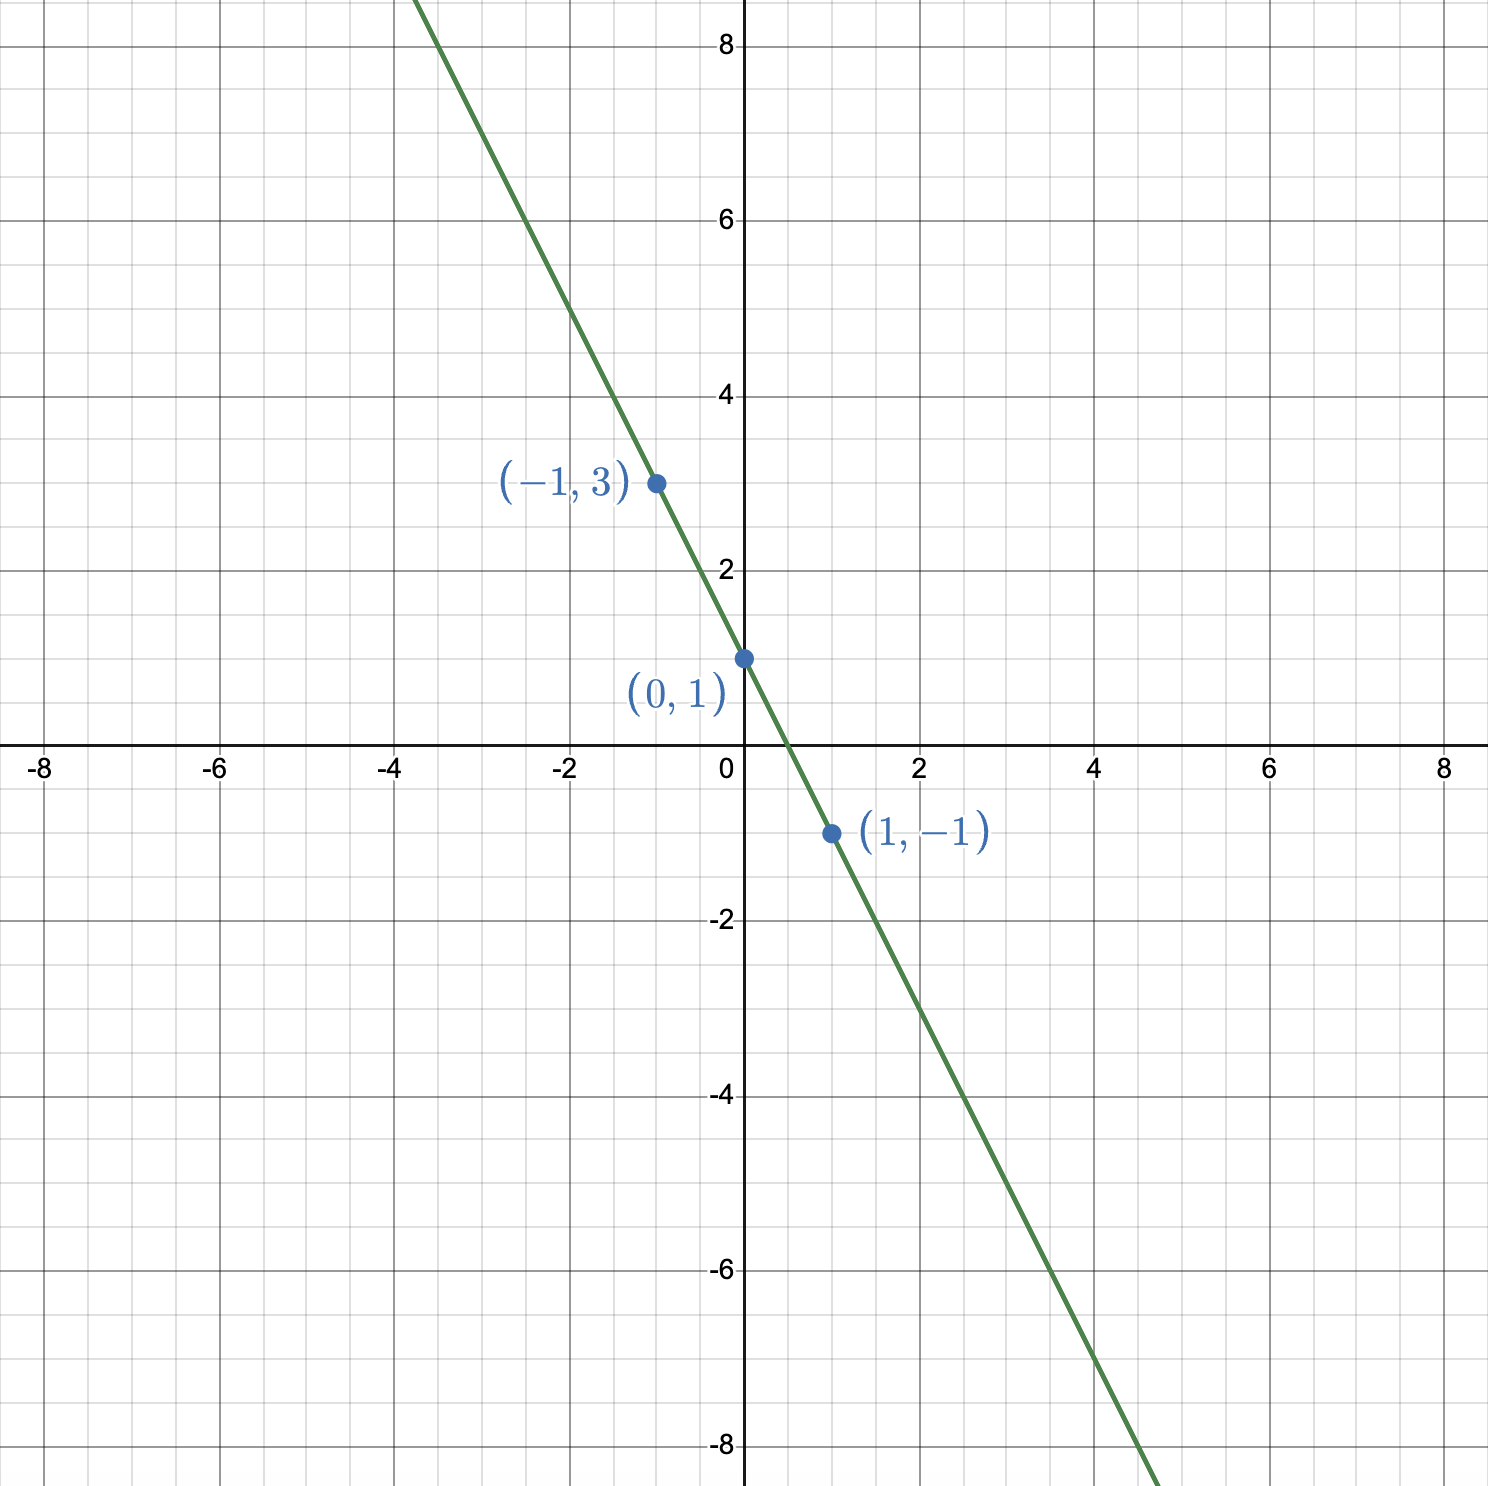
The slope is \(-2\), and the \(y\)-intercept is \(1\).
Key points:
\[ (-1,3),\ (0,1),\ (1,-1) \]
Problem 3
Graph the linear function.
Show solution
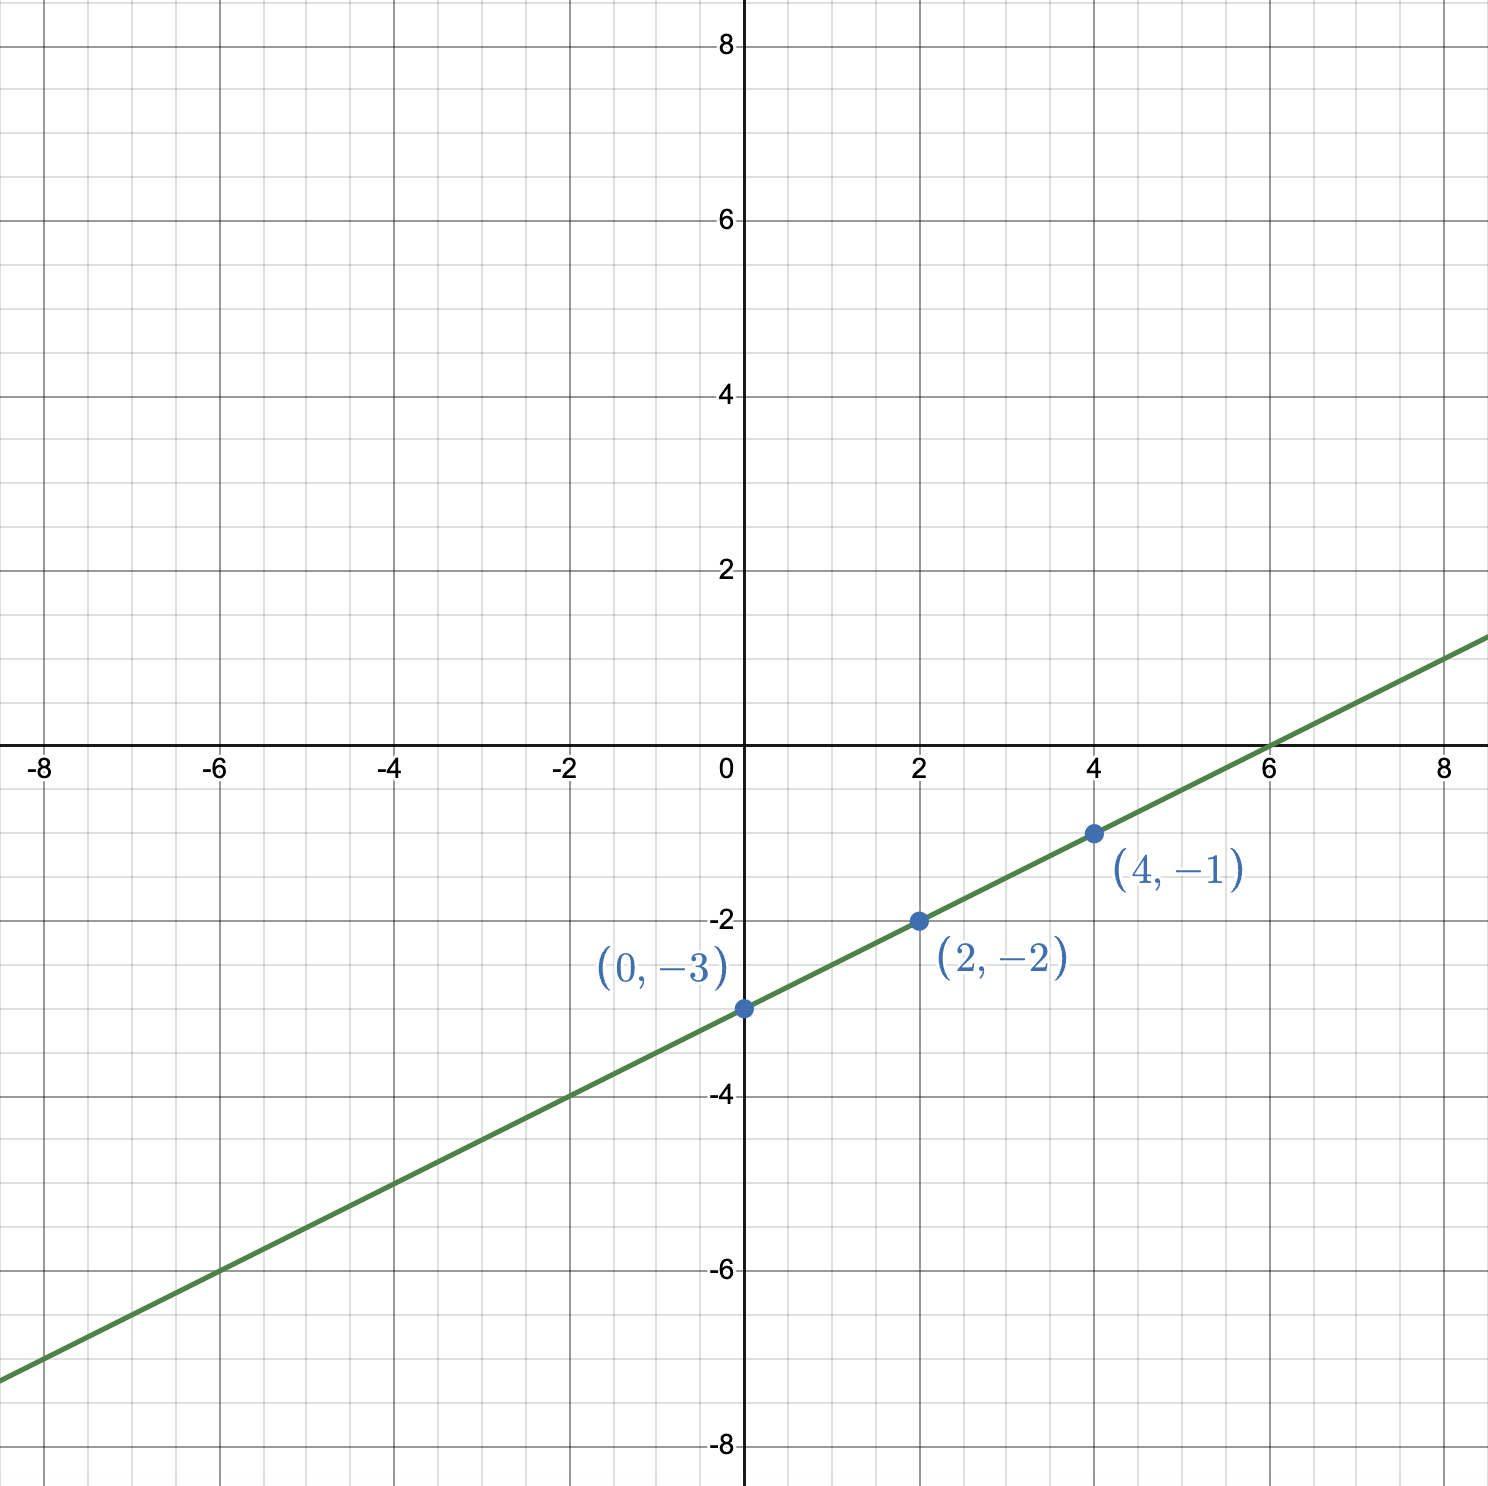
The slope is \(\frac{1}{2}\), and the \(y\)-intercept is \(-3\).
Key points:
\[ (0,-3),\ (2,-2),\ (4,-1) \]
Level 2: Standard Form
Problem 4
Graph the linear function.
Show solution
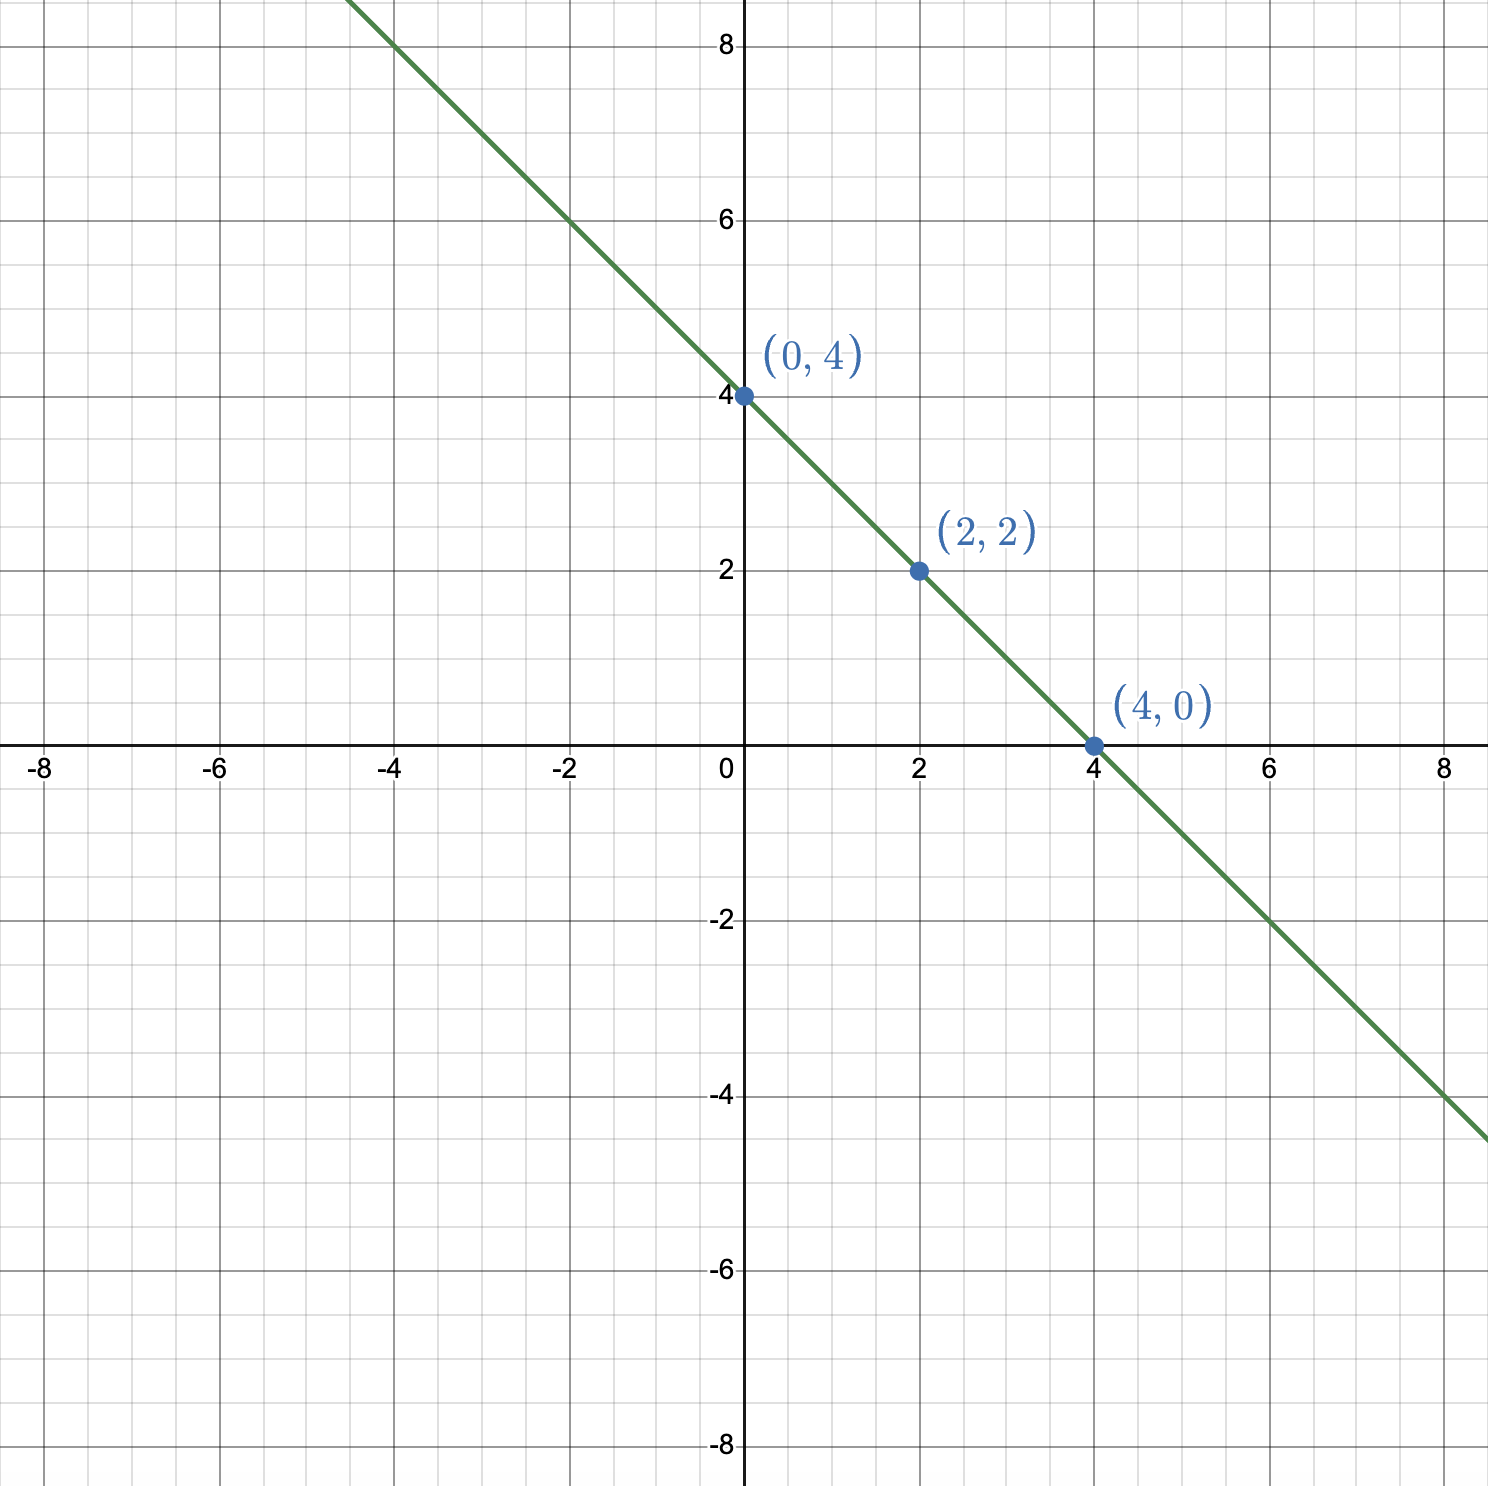
Solve for \(y\):
The slope is \(-1\), and the \(y\)-intercept is \(4\).
Key points:
\[ (0,4),\ (2,2),\ (4,0) \]
Problem 5
Graph the linear function.
Show solution
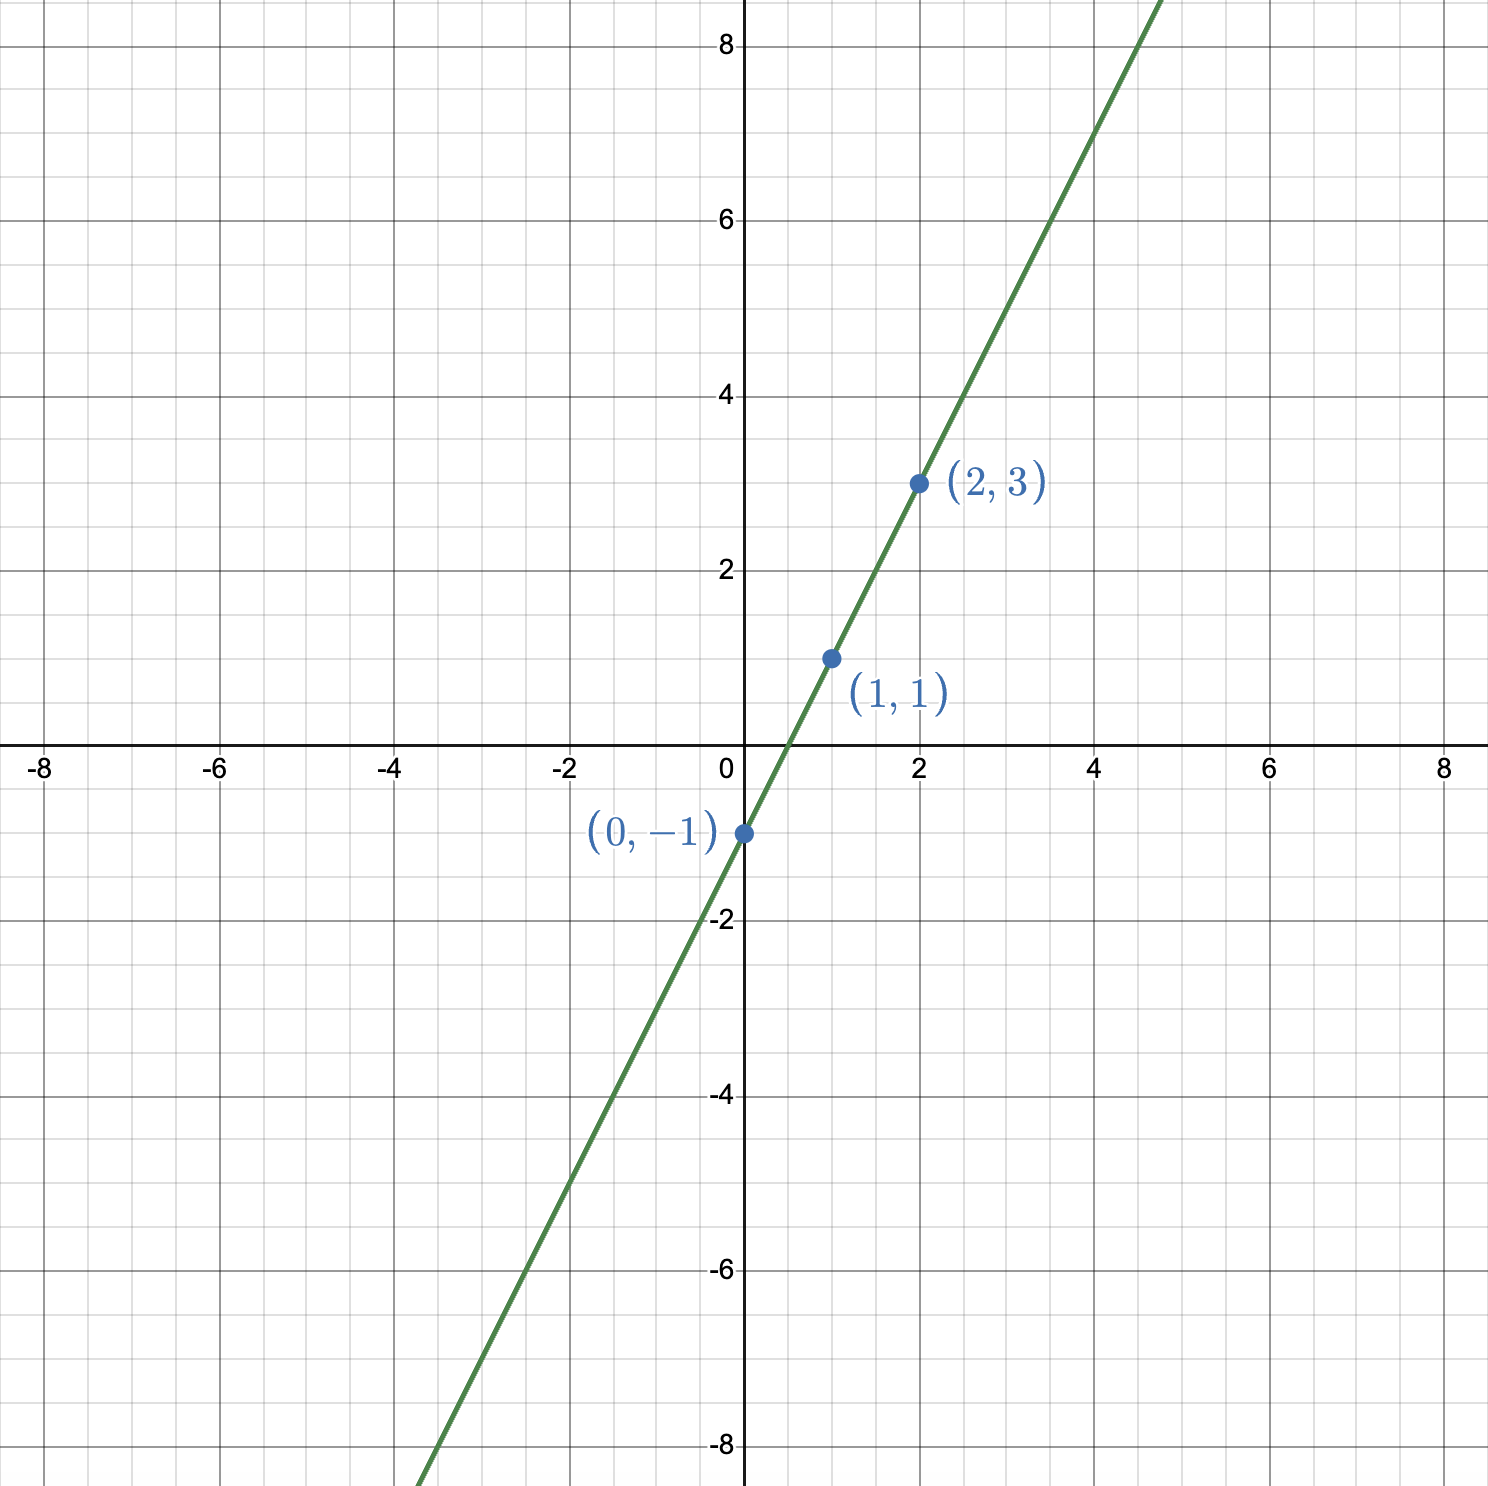
Solve for \(y\):
The slope is \(2\), and the \(y\)-intercept is \(-1\).
Key points:
\[ (0,-1),\ (1,1),\ (2,3) \]
Need more help with graphing linear functions?
Graphing linear equations becomes much easier when you understand slope, intercepts, and how to build points from an equation. For a full explanation, visit my graphing linear functions guide.